What is the CASC Score?
Outlining the APImetrics performance scoring system
Key Concepts
The CASC (Cloud API Service Consistency) score is a simple, easy-to-understand credit rating-like metric that blends together a number of metrics for each API (including availability, latency, and number of outliers) using proprietary machine learning technology benchmarked against APImetrics unrivaled dataset of historical API test call results to give a single number between 0 and 9.99 that indicates the relative quality of the API over a given period. The CASC score allows you at a glance to see the quality of an API, whether it is getting better or worse and how it compares to other APIs.
Scoring
Scores are generated on a weekly (Monday-Sunday) and calendar month basis.
What does a score mean?
Over 8.0You'll have few issues with your API, indicating things are generally doing well and we would expect you'll have no more than 1-4, typically minor incidents a month tying up no more than 400 hours of engineering investigation effort.
Between 6.0-7.99The API is underperforming, with significant performance periods where users are impacted. The lower the score in this area and the more likely the incidence of serious API problems is. This could end up tying up up to 1,200 hours of effort a year or more.
Below 6.0Unacceptable performance from the API leading to significant performance issues impacting users. Expect to have engineers working full time on issues.
Insights Reporting
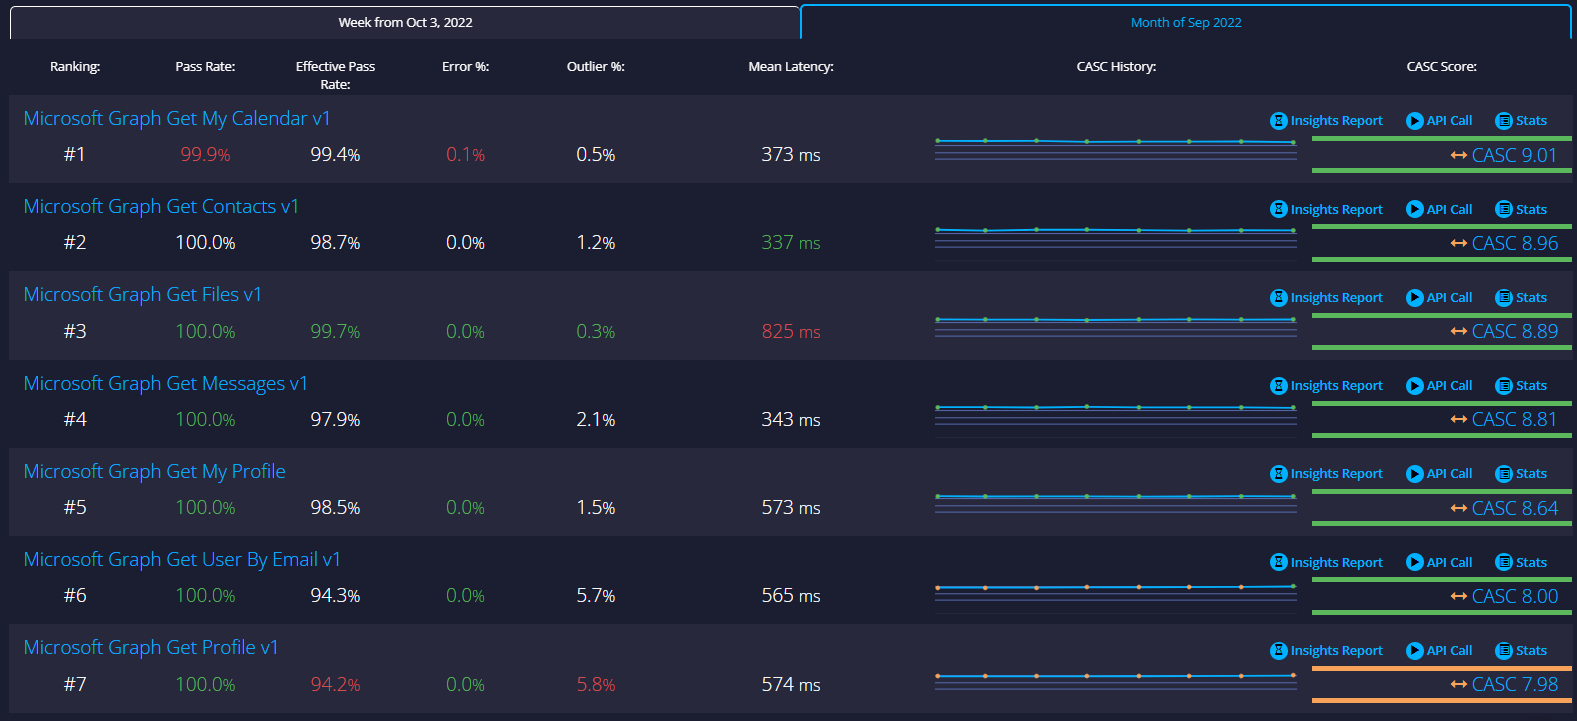
Insights are accessed from the main navigation menu. You can pick weekly or monthly data from the tabs.
For your current project the URL for the Insights report will always be: https://client.apimetrics.io/insights/
See at a glance how well the quality of an APIYou can compare instantly compare the quality of different API in a particular period, whether it is trending up or down or if an individual API is performing worse than other.
The Insights Summary page
The CASC score is shown on the far right with links to access the full report, edit the API call or access the detailed current statistics for the API.
Clicking on the API name OR the CASC score will also access the Insights report.

Insights Analysis
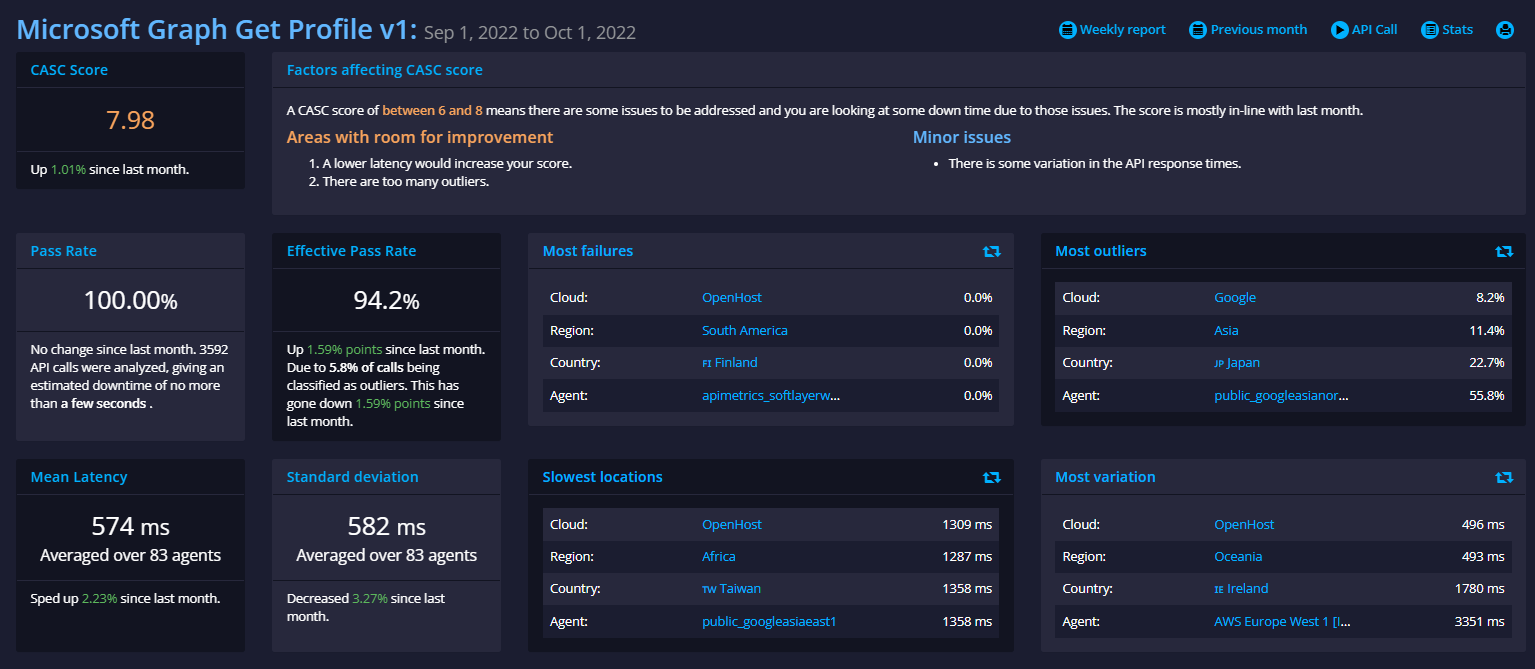
The Insights analysis page is broken into 3 key sections:
- A high-level summary - with the score, an overview of what the key problems our systems have observed and the primary cloud locations with issues
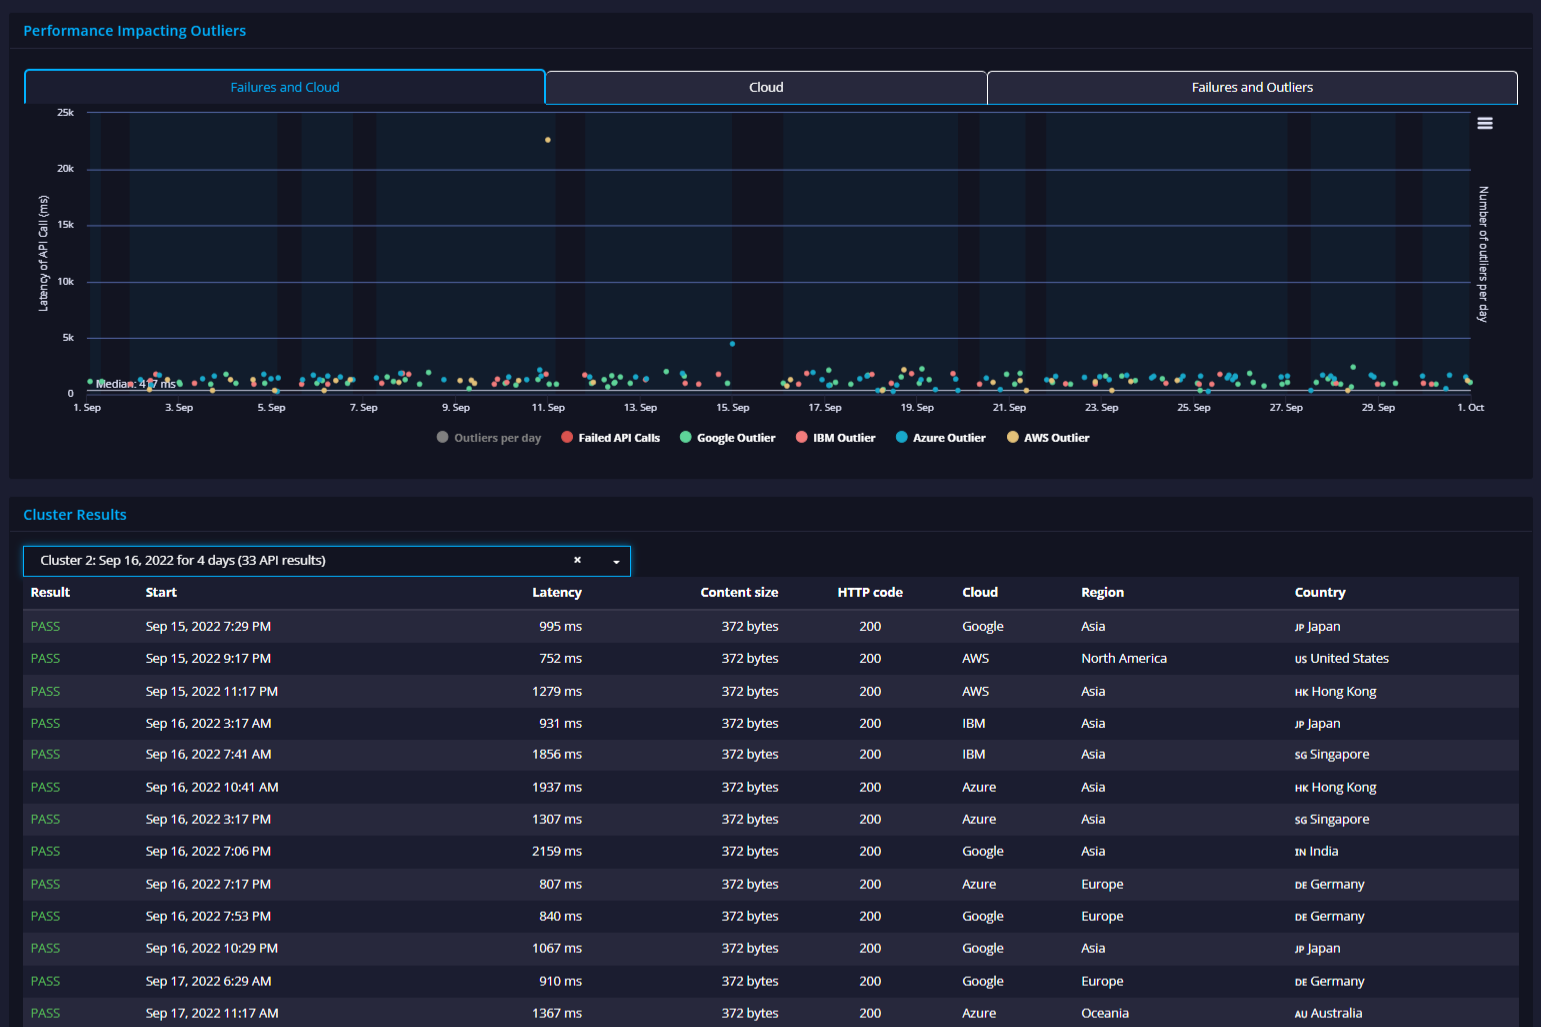
- Outlier analysis - showing the incidence of performance outliers (i.e. items that fall outside of the normal performance parameters) and failures
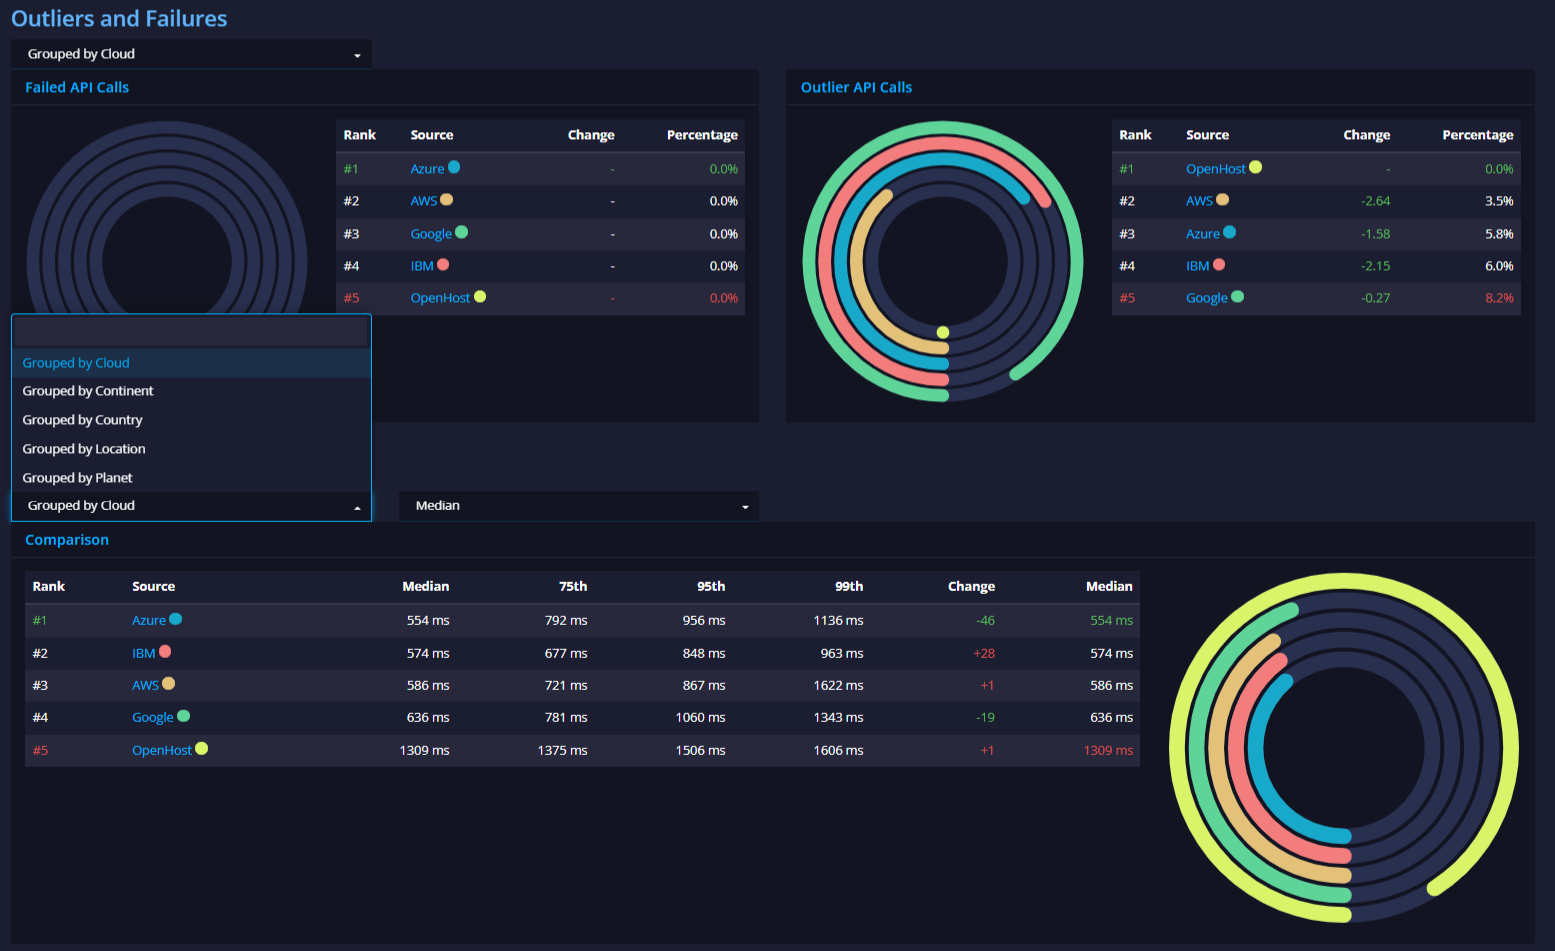
- regional, cloud and related performance by data center including percentile analysis

The next section shows the outliers detected during the time period. Outliers are shown either as failures (in red) or as a dot colored according to the cloud data center the call originated from. You'll see that we also have implemented cluster detection and in the drop-down menu below the chart you can pick up all the results in a cluster including latency, content side, and the cloud location the call originated.
Clicking on the result will take you directly to the call result - if you have implemented 'water marking' of calls this will give you a key to use for analysis inside your systems.

The final section provides percentile analysis based on the location, region or cloud the calls originated from and indicate which cloud/data center combinations might provide a better customer experience.

Updated 7 months ago