Home Page
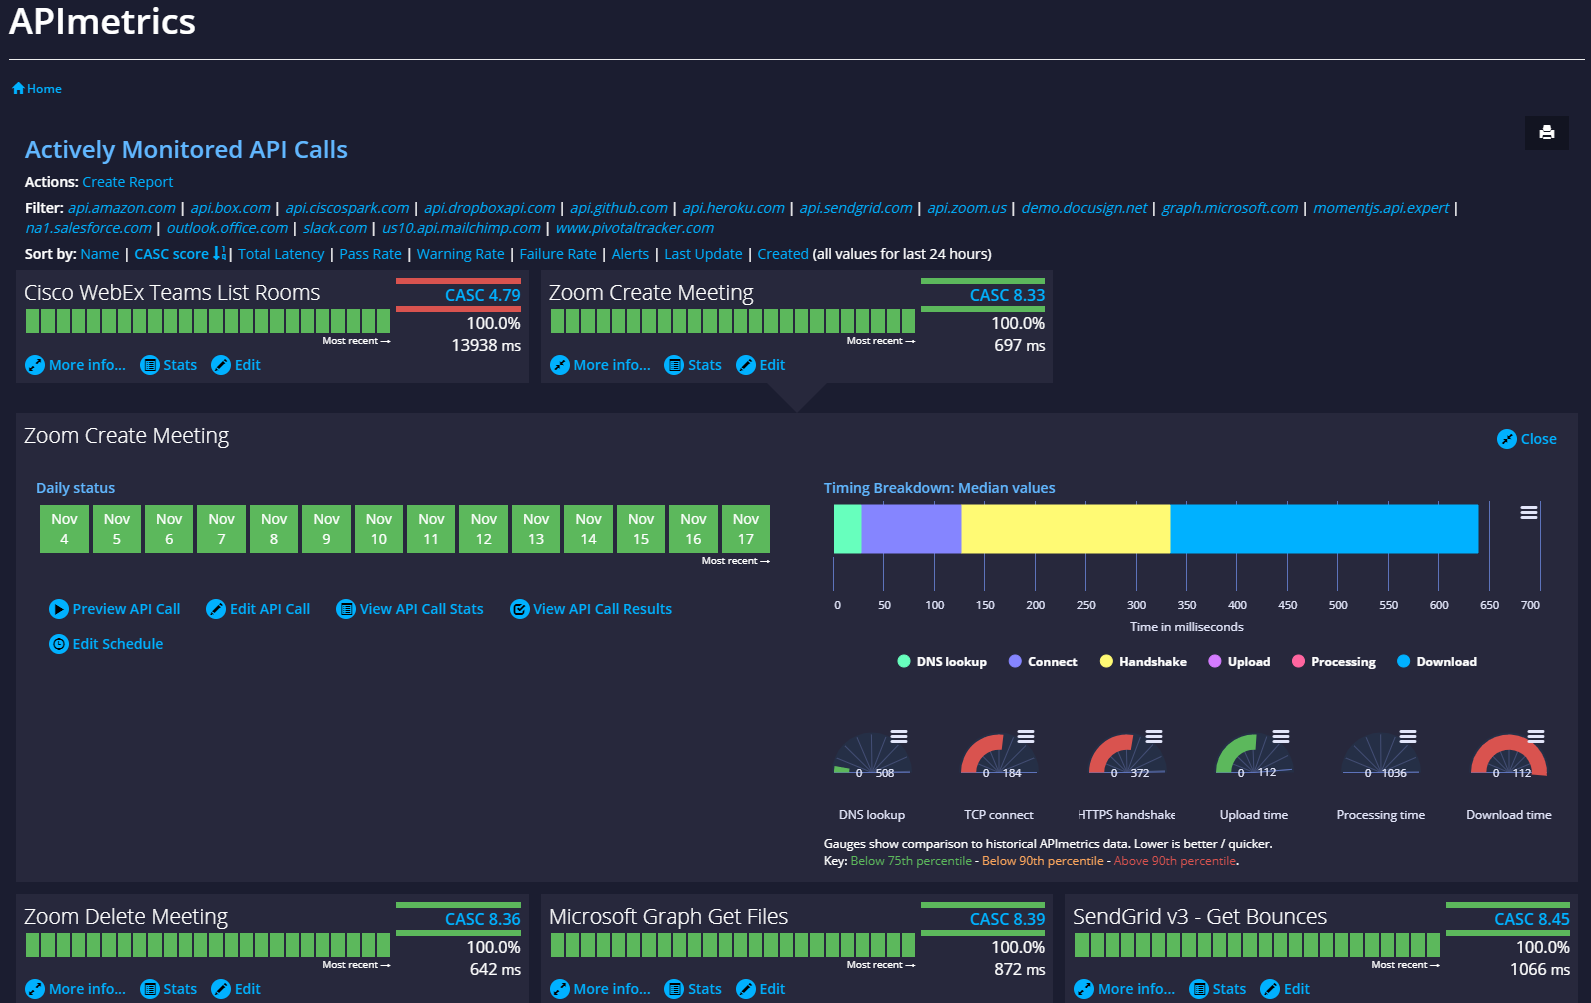
The top-level dashboard of the APIs in a particular project.
The homepage shows basic information on all your currently monitored API calls - this includes quick links to the Insights Report, Stats page and editing options.
Each box represents an hour of the last 24 hours.
- solid green indicates no issues.
- red or yellow indicate there have been failures or warnings in the period
Clicking on the box will take you to the results for that time period.
The Card can be expanded by clicking on 'More Info' which will show the last 14 days and a breakdown by API call segment of the median timings.

Updated 7 months ago