Creating Reports
Creating a report provides a simple summary of data that can be shared internally or externally.
Key Concepts
Reports are a great way of summarizing the statistics associated with calls and seeing at a glance how an API has been behaving.
Creating a Report from an API Call or Workflow
You can create reports in several ways:
- From the Homepage, CREATE REPORT is above the domain filters
- From an API or Workflow EDIT view
- From the API list
- From the Report menu
Once created, reports can be edited.

Creating From the Report Menu
In the report view list on the left hand navigation, select Create New Report.
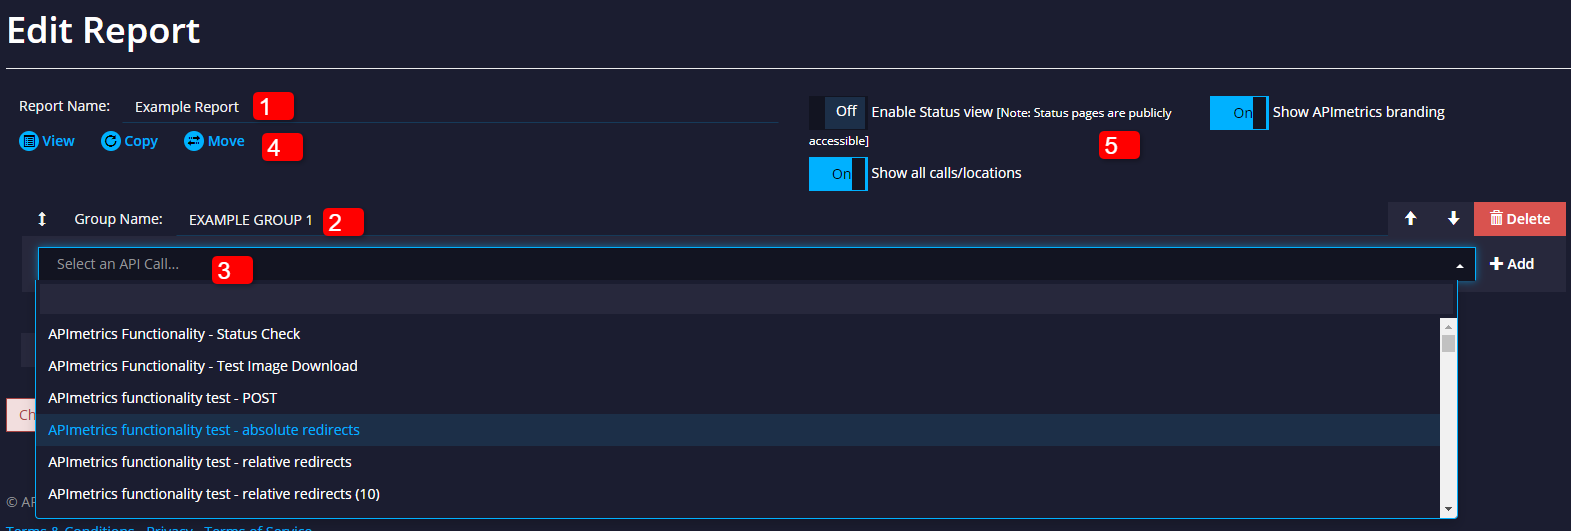
Reports are split into GROUPS. In each group you can chose APIs to include.

In the report editor:
- Report Name - editable
- Group Name - editable
- API Picker > add an API to a report
- Report controls:
- VIEW - see the report
- COPY - make a copy of your report in the project
- MOVE - move the report to another project
- Public Sharing - create a public dashboard of your report
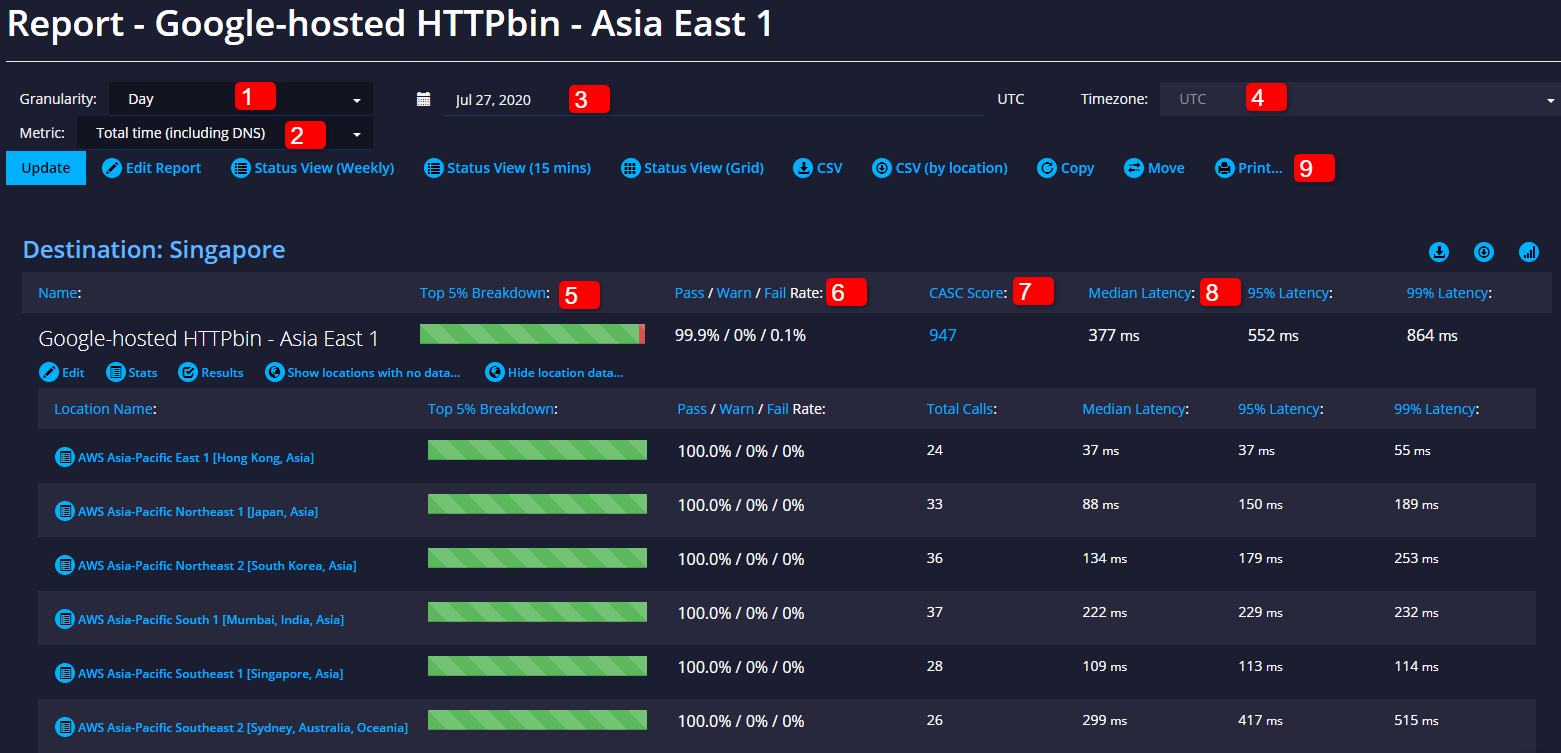
Reports at a glance

- Select time period for report > day, month, year
- Select report call time slice > DNS, TLS, TCP, Upload, Processing, Download
- Date Picker
- Set or override local Timezone
- Breakdown of the last 5% of calls
- Pass/Fail/Warning percentages
- CASC Score - will take you to the insights view
- Latency breakdown
- Report controls
- Edit
- Status views for public sharing > grid or list options
- CSV download
- Copy > make a local copy in the project
- Move to another project
- Print > print a PDF formated version of the report
Making a Report Public
In the edit screen, select the 'Make report public' checkbox. When you view the report you'll have 2 options either the last week, showing uptime in the last hour, week or day, or the last 15 minutes.
You can also send a URL for the report to your colleagues that they can view if they have an APImetrics account and permission to view the report.
Updated 5 months ago