Postman Collection Monitors
If you already have your API calls set up in Postman, no need to duplicate the setups in APImetrics
If you have your API calls and tests in PostmanPostman, duplicating effort to add them to APImetrics can seem like a daunting task.
To solve this problem, we offer the option to manage your collections in Postman but take advantage of running calls through our data centers (only available for Google, AWS and Azure locations) and generate analysis and insight using APImetrics.
For this to work, you will need to configure a Postman API key (which is covered here AND generate an APImetrics API key - if you do not have an APImetrics API key, you can generate this when you link Postman and APImetrics.
Importing APIs also availableIf you'd rather import your API definitions from Postman or a variety of other formats, see the Importing API Calls and Importing from Postman pages.
Postman Monitoring uses the Postman APIMake sure your Postman subscription has enough quota
Setup
To get started, on the Monitor Postman Collection page, click "Configure a new Postman Collection monitor".

You may need to generate an APImetrics API key - click "Generate Auth Settings" to continue.

Select your Collection and Environment

Select the Collection you wish to monitor. On the next page select the Environment (if any) you wish to use.
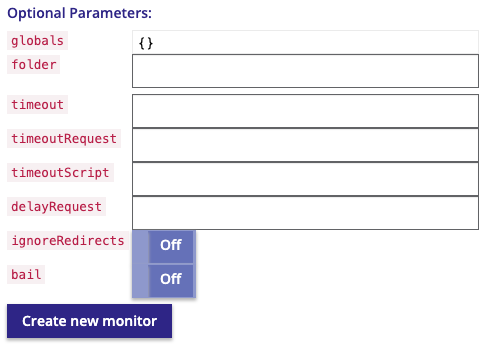
On the last page, there are some optional parameters you may add or change. Once happy, press "Create new monitor" to create the monitor.

The collection will appear under your Configured Postman collection list at the top.

Start monitoring
Schedule your collectionYou must schedule the collection to start monitoring
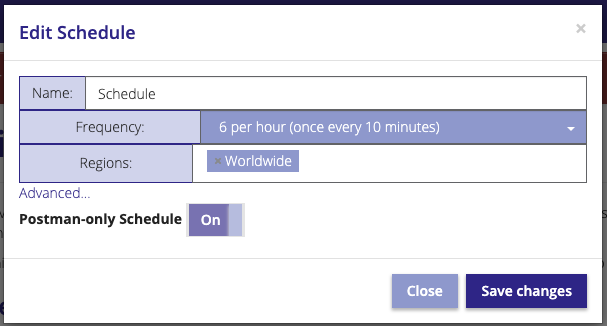
Select a schedule to start monitoring. The schedule must be a Postman-only schedule as the Postman monitors are only available on a sub-set of our locations.

You can use the Add Schedule button to create a new schedule:

Once the Collection monitoring starts, your account will be populated with the API calls in the collection, and the results will appear. Note that you cannot edit the API calls in APImetrics - you must save any changes to the Collection from Postman.
Ensure timing accuracyAs we’re running the Postman Collections “natively”, it re-uses connections when running sequential calls in a collection. This means that will see DNS lookup, TCP connection time and SSL handshake values will appear as 0ms for subsequent API calls. In order to avoid that, add a “Connection: close” header to the API calls in the Collection. This is purely optional, but will mean we get more accurate timings.
Updated 7 months ago